Hi, this is CoinFirstStep. CVD, or cumulative volume delta, is a running total of taker buy volume minus taker sell volume. When it rises, buyers who trade right away are stronger; when it falls, sellers who trade right away are stronger. It's most useful when you compare its direction with the price.
This guide explains how CVD is built, four ways to read it, where to find it, and what one real month of Bitcoin data showed on Binance.
20% commission rebate
Referral link: you get a 20% commission rebate on your trading fees (disclosure).
At a glance
| What it is | Taker buy volume minus taker sell volume, added up over time |
|---|---|
| Rising CVD | Buyers who trade right away are stronger |
| Falling CVD | Sellers who trade right away are stronger |
| How to use it | Compare its direction with the price |
| Where to see it | TradingView, CoinGlass, or your exchange's candle data |
1. What is CVD in crypto trading?
Every trade has two sides. The maker placed an order earlier and is waiting in the order book. The taker trades with that order right away, usually with a market order. On Binance, a limit order that fills the moment you place it also counts as a taker order.
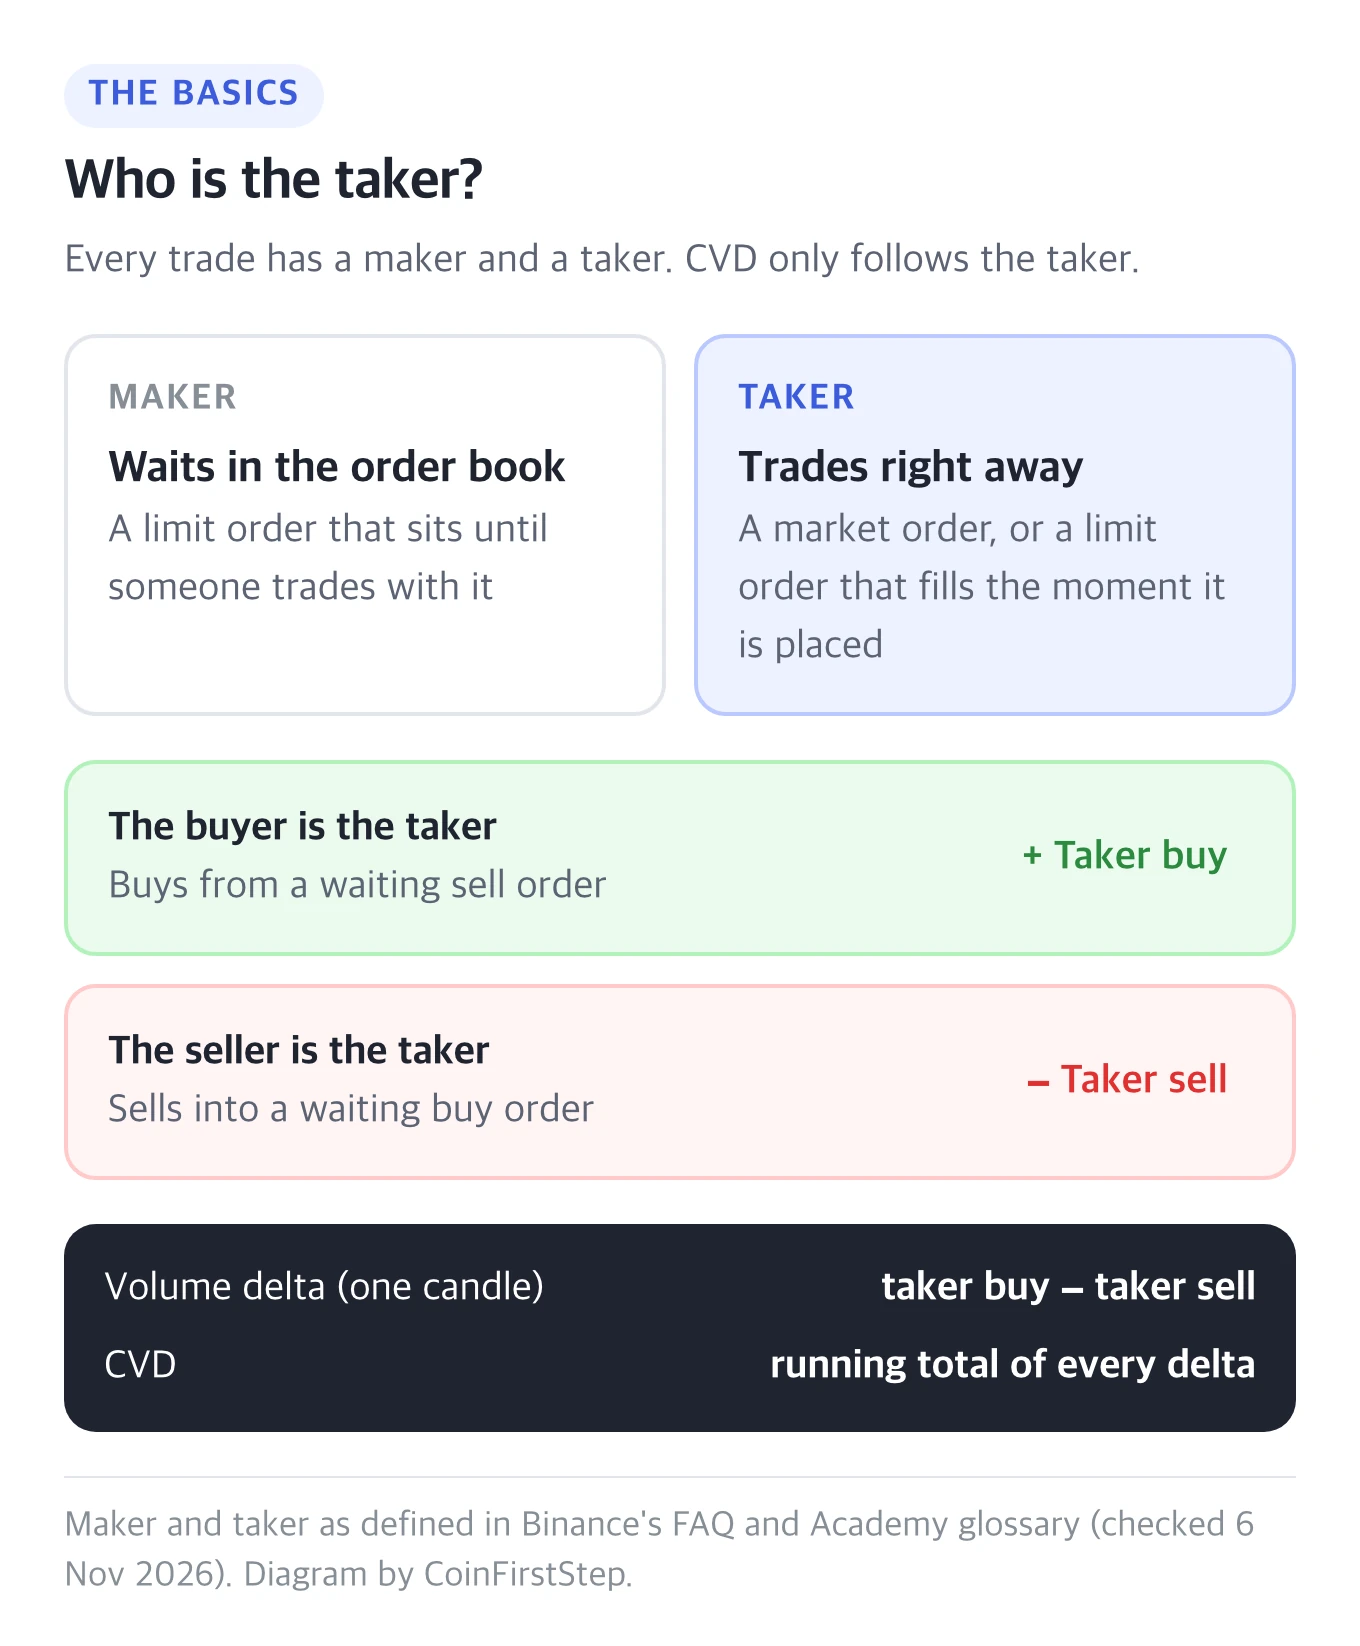
The taker is the one who chose speed over price, so the taker's side shows where the pressure is. Volume delta is taker buy minus taker sell for one candle. CVD adds those deltas up, candle after candle, into one line.
2. How CVD is calculated
Here is the whole calculation with five candles and round numbers.
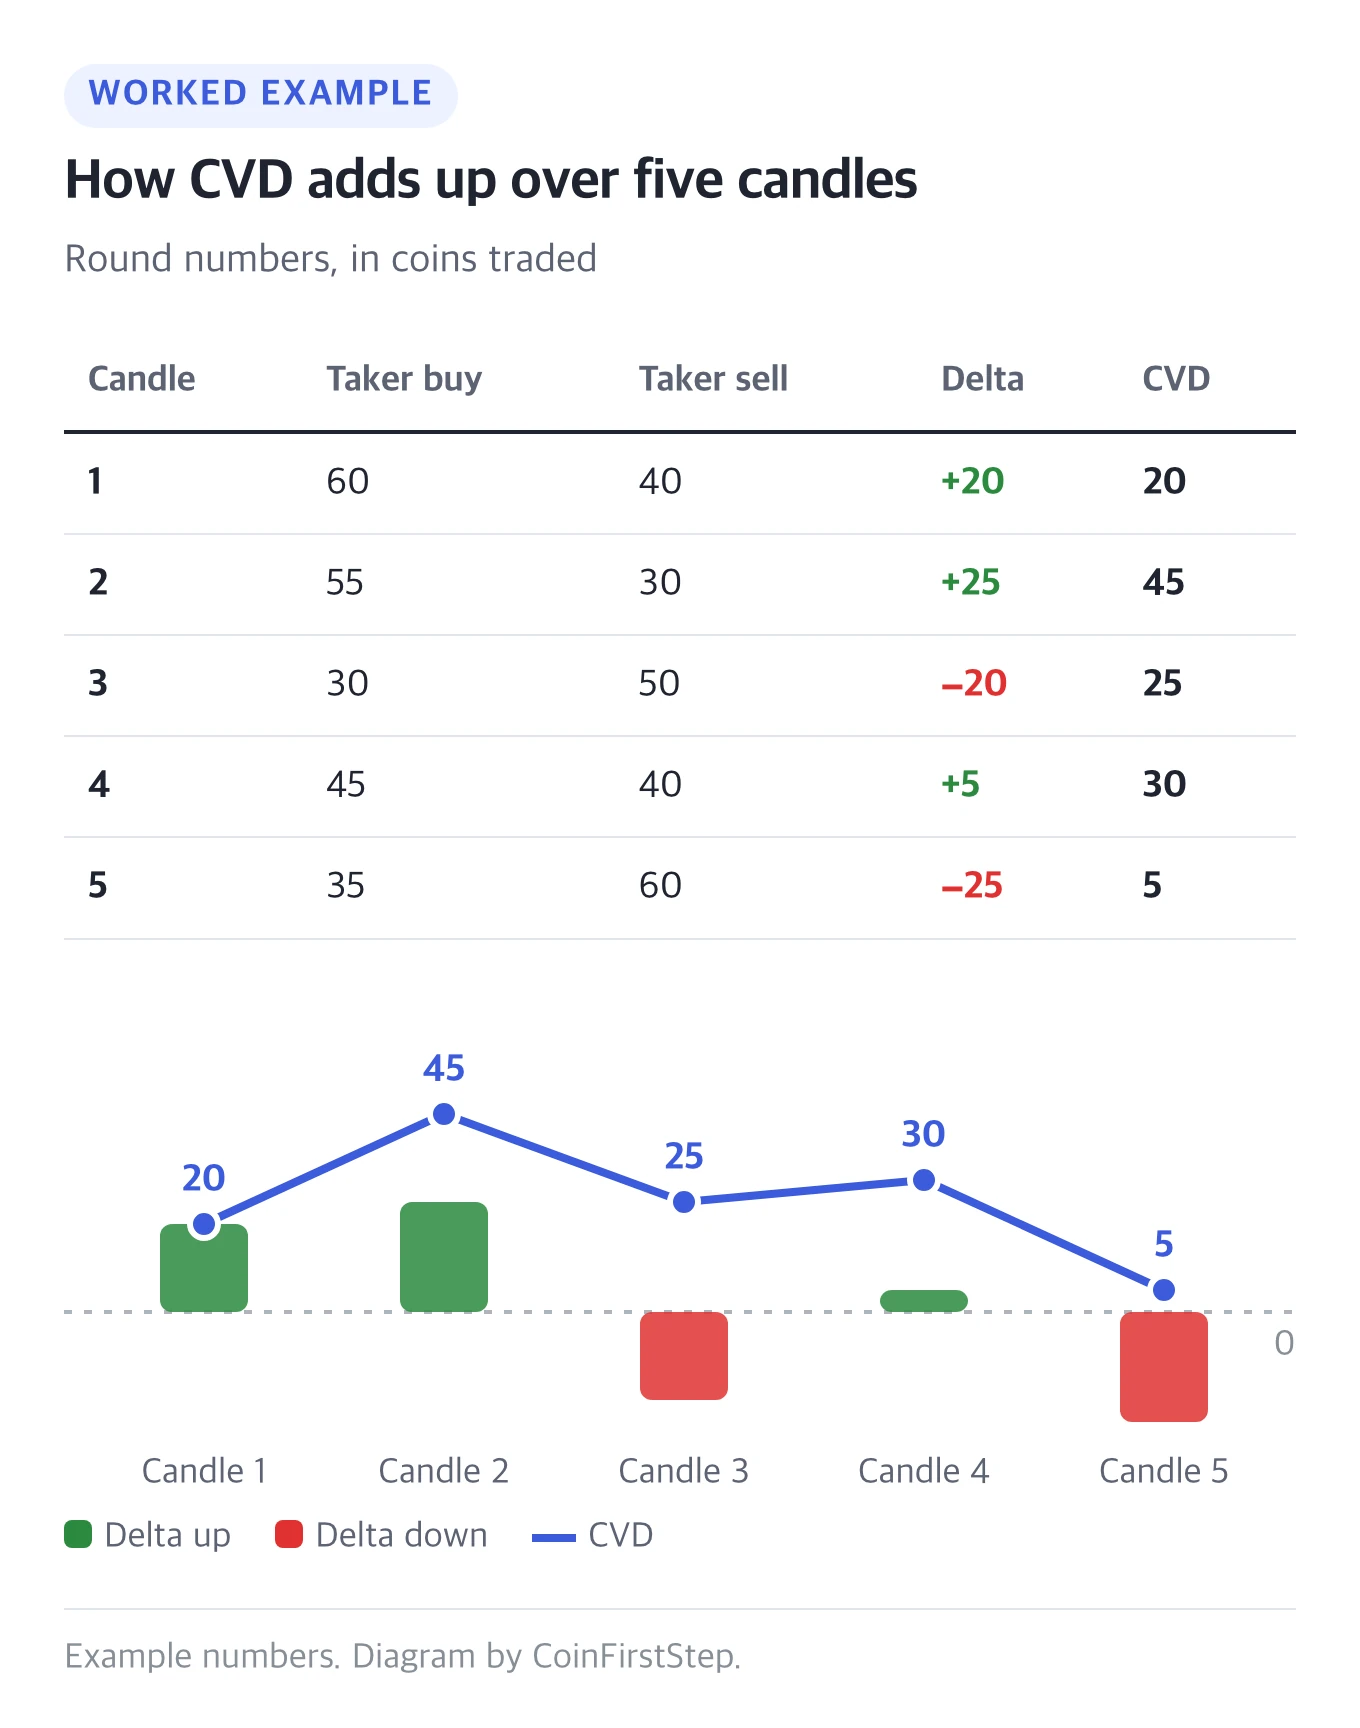
In candle 1, takers bought 60 and sold 40, so the delta is +20 and CVD is 20. Candle 2 adds +25, so CVD becomes 45. Candle 3 has more taker selling, so the delta is −20 and CVD drops to 25. By candle 5, CVD is back down to 5.
Exchange data often gives you only total volume and taker buy volume. Then taker sell is the total minus taker buy, and the delta is two times taker buy minus the total.
▣ Read the direction, not the number
CVD's level depends on where the count started, so +5 or +5,000 means little on its own. What matters is whether the line is rising, falling or flat, and how that compares with the price.
3. How to read CVD
There are four situations worth knowing. Each compares the direction of price with the direction of CVD.
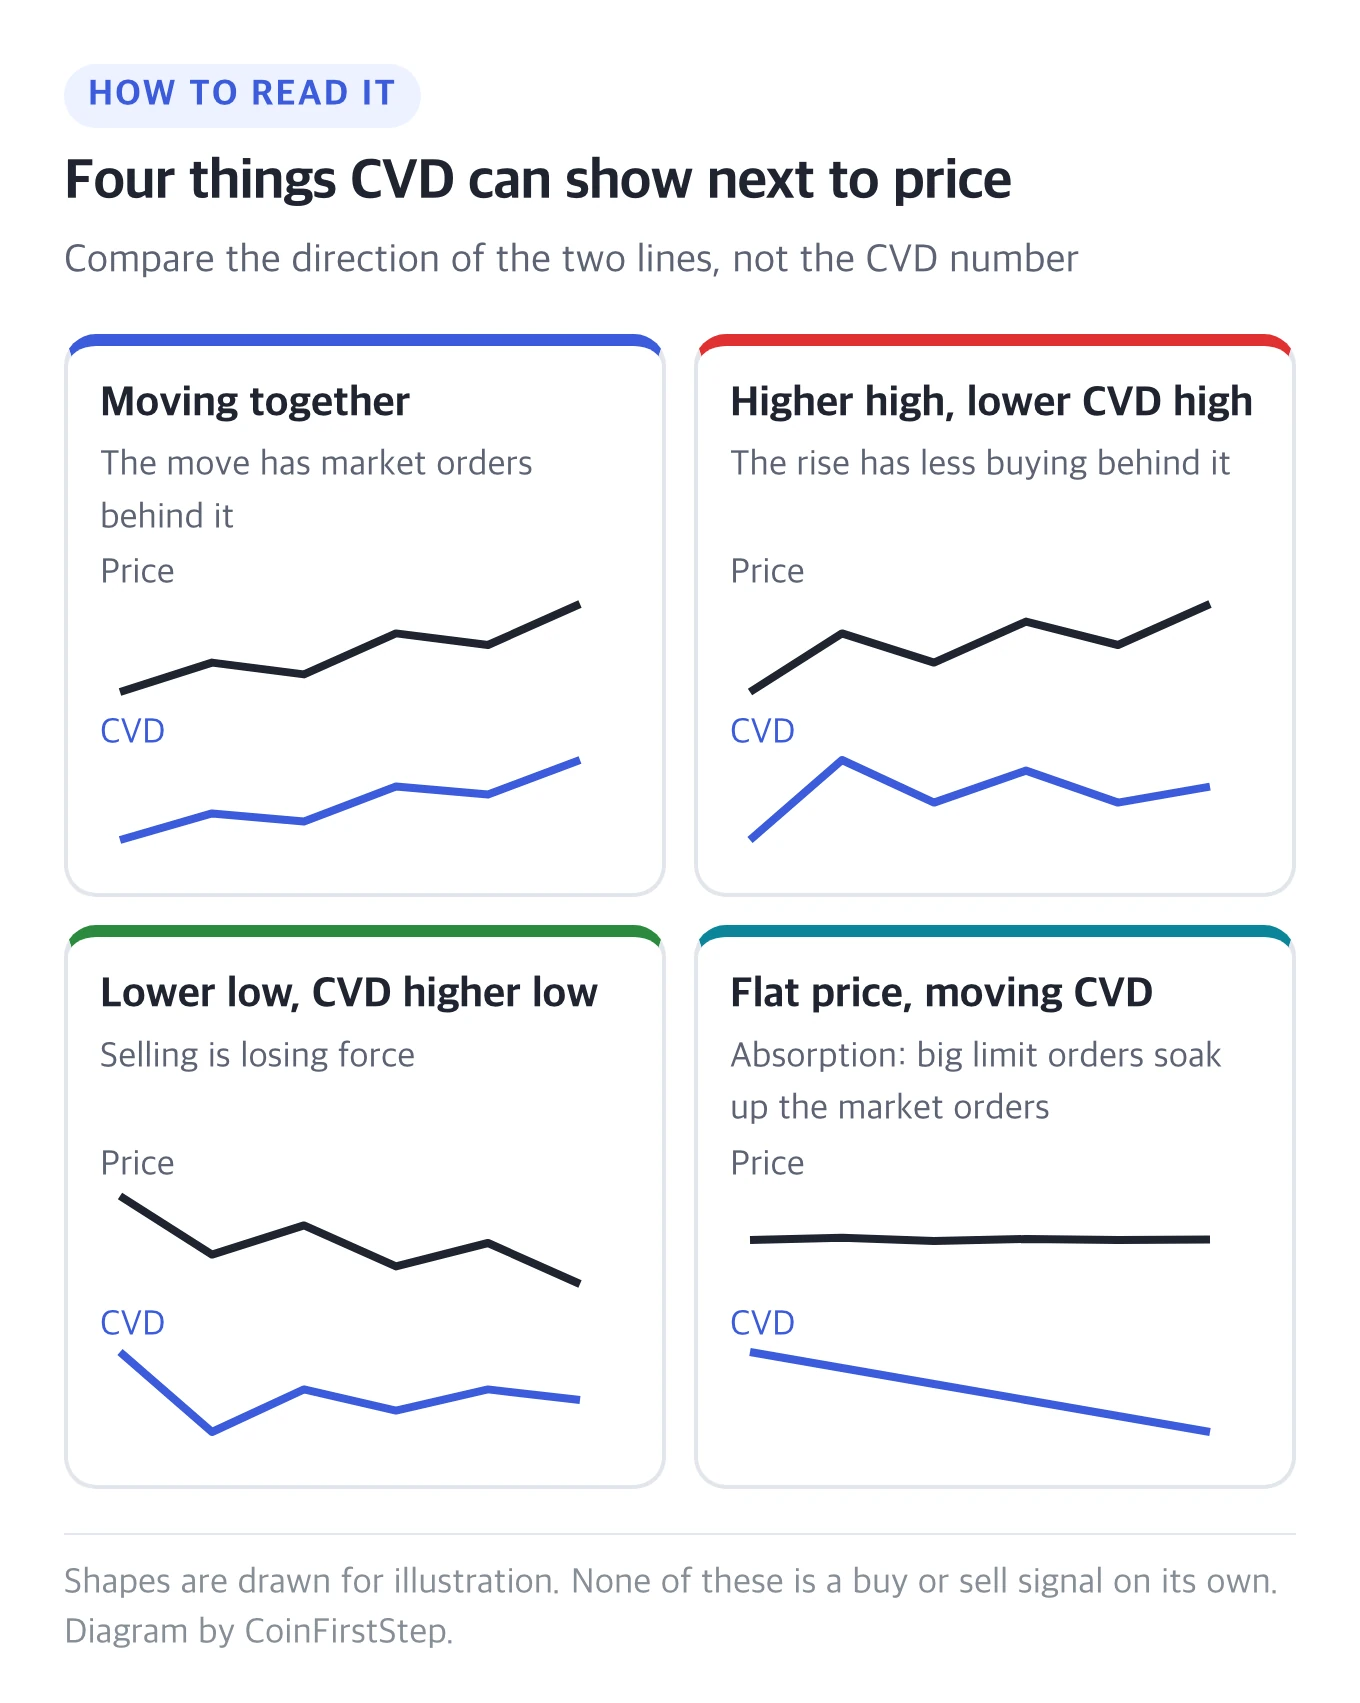
Moving together. Price and CVD rise together, or fall together. Takers are driving the move.
Price higher high, CVD lower high. The price is still climbing, but less taker buying is behind each new high. The rise may be weaker than it looks.
Price lower low, CVD higher low. The price keeps falling, but taker selling is fading. The drop may be losing force.
Flat price, moving CVD: absorption. If CVD falls while the price holds, large limit buy orders may be soaking up the selling. If CVD rises while the price stays put, large limit sell orders may be soaking up the buying.
▣ None of these is a signal on its own
They tell you what kind of orders are behind a move. Read them together with the price levels you already watch, such as a recent high or low.
4. A real CVD example on BTC/USDT
This chart uses one month of Binance spot data for BTC/USDT on 4-hour candles, from 6 October to 5 November 2026. CVD is built from the taker buy volume Binance reports for each candle.
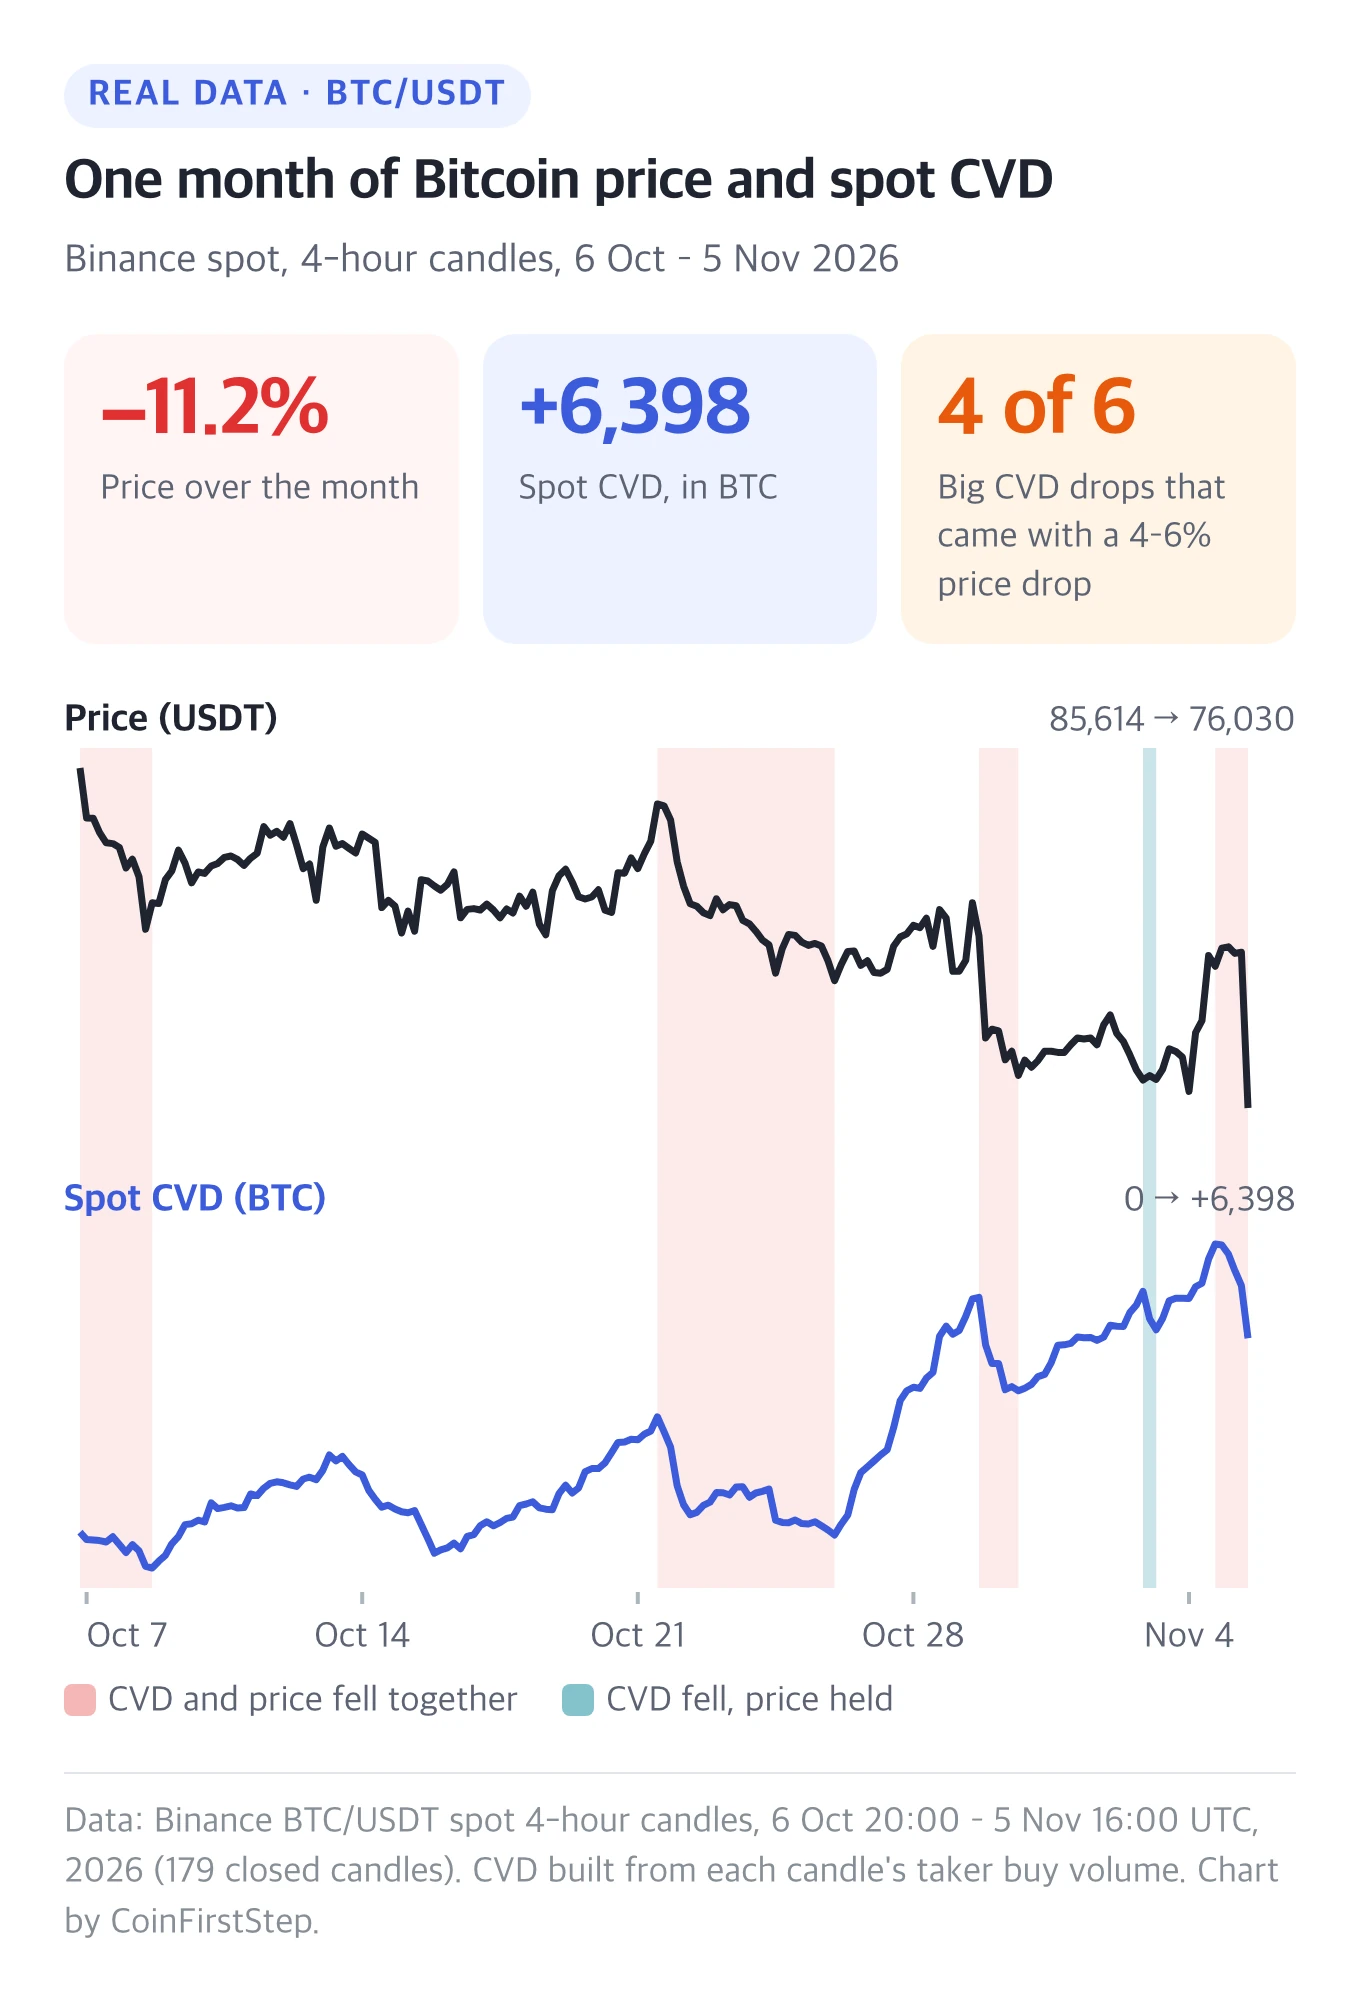
Zoom out, and it's a divergence. The price fell 11.2% over the month, yet spot CVD ended 6,398 BTC higher. On balance, spot takers bought more than they sold.
Zoom in, and the sharp drops look different. Spot CVD fell by more than 1,000 BTC from a recent peak six times during the month. In four of those six, the price fell 4–6% at the same time (the red bands). In one more, on 2–3 November, CVD fell about 1,280 BTC while the price barely moved (the teal band). In the last one, on 13–15 October, CVD fell about 3,300 BTC while the price slipped only about 2%. The two biggest down candles, at −5.4% and −3.5%, also had the two most negative deltas of the month.
CVD also showed absorption on single candles:
| Candle (UTC) | Spot delta | Price move |
|---|---|---|
| 26 Oct, 12:00 | +849 BTC | +0.01% |
| 3 Nov, 00:00 | −908 BTC | +0.16% |
On 26 October, heavy taker buying didn't lift the price, a sign that limit sellers were absorbing it. On 3 November, heavy taker selling didn't push the price down, a sign that limit buyers were absorbing it. Both deltas were more than four times the size of a typical candle's delta that month (the median delta size, up or down, was about 187 BTC). The 3 November candle sits inside the teal band.
This is one month of history. It shows how to read CVD at two zoom levels, not what Bitcoin will do next.
5. Spot CVD vs futures CVD
If spot takers were net buyers, where did the selling come from? Binance's futures candles carry the same taker buy data, so futures CVD can be built the same way for the same month.
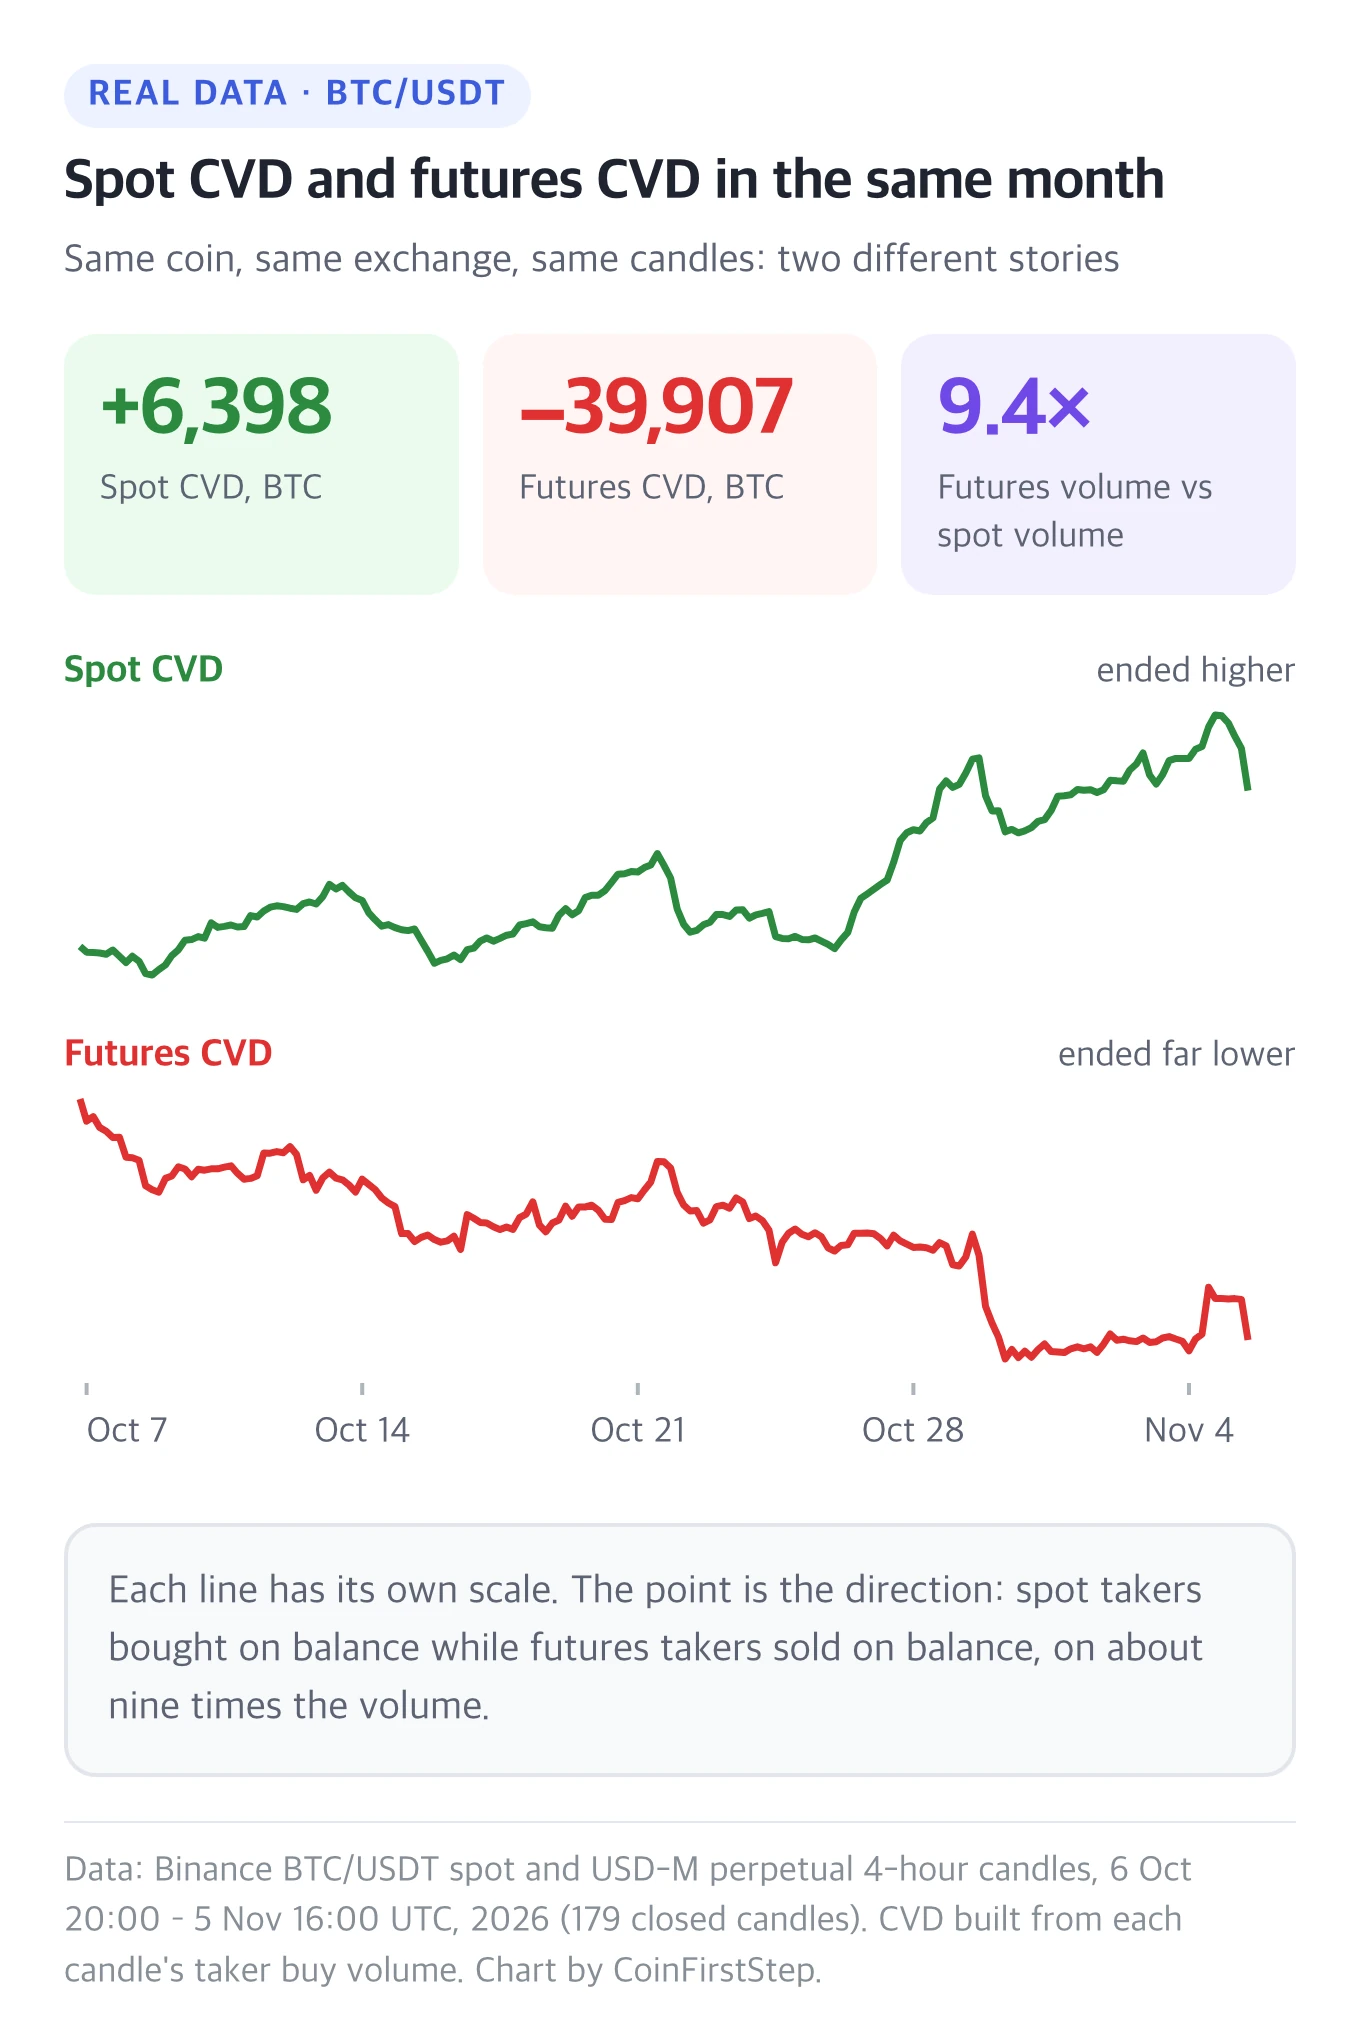
Futures CVD fell by 39,907 BTC while spot CVD rose by 6,398 BTC, and futures volume was about 9.4 times spot volume. Spot takers bought more than they sold, while futures takers sold far more than they bought.
That doesn't prove futures caused the drop, but it shows where the taker selling was. It's also why I look at spot and futures CVD side by side before trusting a move.
A futures taker sell can open a new short or close an existing long, and CVD can't tell which. Open interest shows whether the number of open positions grew or shrank at the same time. If you're new to futures, how a first futures trade works on Binance explains the basics.
6. Where to see CVD
| TradingView indicator | An estimate from smaller candles inside each candle. Quick to add to any chart |
|---|---|
| CoinGlass CVD page | Taker volume added up across many exchanges, in US dollars |
| Exchange candle data | The taker buy volume one exchange records, for spot or futures |
TradingView has a built-in indicator called Cumulative Volume Delta. Search for it in the Indicators menu. It is drawn as candles in its own pane: each candle opens where the last one closed, and the total restarts at zero at the start of each anchor period, which you set in the indicator's inputs. By default, it estimates buying and selling from smaller candles inside each candle: a smaller candle's whole volume counts as buying if it closed up and as selling if it closed down. It uses the volume of the symbol on your chart, so check whether the chart shows spot or perpetual futures. There is also an optional tick-based mode, off by default, which needs a plan with tick data.
Binance candle data includes the taker buy volume for every candle, for both spot and USD-M futures. That's the data behind the charts in section 4, A real CVD example on BTC/USDT, and section 5, Spot CVD vs futures CVD.
CoinGlass has a CVD page that adds up taker volume from 22 exchanges (13 futures and 9 spot, as of 7 November 2026) and shows it in US dollars. You can view spot, futures, both combined, or spot and futures as two separate lines.
The three sources can look different for the same coin. TradingView estimates, Binance data is one exchange's own record, and CoinGlass adds many exchanges together and counts dollars instead of BTC.
If you plan to trade on Binance and don't have an account yet, the step-by-step sign-up guide covers sign-up and identity verification.
7. Limits of CVD
| One market at a time | Check spot and futures, and other exchanges if you can |
|---|---|
| Sources differ | Compare like with like |
| It describes the past | Use it with price levels and your own risk limits |
Rising CVD is not a reason to buy on its own. In the month in section 4, A real CVD example on BTC/USDT, spot CVD rose while the price fell 11.2%. Don't act on CVD alone.
Crypto prices are volatile, and you can lose money. This is an explainer, not investment advice.
8. Cumulative volume delta FAQ
What is the difference between volume and CVD?
Volume counts how much traded. CVD counts how much more takers bought than sold, and keeps a running total.
Is rising CVD bullish?
Not by itself. It means taker buyers are stronger, but the price can still fall. See section 7, Limits of CVD.
Which timeframe should I use for CVD?
CVD follows your chart's timeframe. Short timeframes react fast and are noisier, longer ones show the bigger picture. On TradingView, also check the anchor period, because it decides when the total restarts at zero.
Does CVD work on altcoins?
Yes, as long as there is enough trading. On thin markets, a few large trades can move CVD a lot.
Is CVD the same as the Fear & Greed Index?
No. CVD is built from actual trades, on one market or on several added together. The crypto Fear & Greed Index is one daily score built from several kinds of data, such as volatility, trading volume and social media.
That covers what CVD is, how to read it, and what one real month of Bitcoin data looked like.
Thanks for reading!